Two portfolios, one integration window
After one of the sector’s largest operators took over a long-standing competitor of comparable scale, a large integration project was started to combine the two companies and to achieve synergies as soon as possible.
Claroview analysed the lion’s share of 50+ systems and 250+ repositories across both organisations, millions of lines of code in 74 languages, to support executive decision making about the target landscape.
“Following the acquisition, Claroview’s consultant and the Maintainability Cloud helped establish an objective and comparable view of the technical state of both organisations’ systems. It provided a solid factual basis for the integration decisions we had to take. Just as valuable, the detail beneath the maintainability scores gave both our development teams and their management reference points to reflect on and improve quality.” — Senior technology leader of the acquiring group
Decide what to keep, replace, or retire, with evidence
Financial and legal due diligence are routine in an acquisition. Software rarely gets the same scrutiny, even when the synergies depend on it. The group wanted every keep, replace or retire decision to rest on measurement rather than on assertion.
Claroview performed in-depth software due diligence investigations to surface comparable signals across both portfolios, making it possible to compare like-for-like across two organisations that had been working on similar business functionalities, sometimes for decades.
The results of the technical investigations were put in executive perspective using the Maintainability Cloud, an at-a-glance overview of size and quality that made software quality, an abstract topic, concrete enough for leadership to act on.
Three parallel tracks, one strategic recommendation
Each key business system or area arrived at one strategic recommendation through three tracks of fact finding and alignment.
- Functional track. Across the five core divisions, assessments were done to understand the similarity of business processes, how these are supported by the respective core systems, and which business functions the target landscape had to support.
- Technical track. Broad assessment of each system’s IT architecture, integration capabilities, usability and user interface, security and compliance. In-depth measurements and analysis of technology stack, code quality and implemented architecture on the candidate systems.
- Business case. Quantification of the investments required, the returns expected and the timelines involved, to support the choice of target platform.
Several client employees and consultants worked alongside each other across these tracks. Claroview’s part was the software due diligence inside the technical track, and the Maintainability Cloud that brought the aggregated final results of that work into a single view for the executive decision.
What the due diligence measured
The analyses covered more ground than scoring alone, and built up a picture of how each development team worked and how mature it was. Six of them:
- Maintainability measurements. Quantitative scoring of source code against a maintainability quality model based on ISO/IEC 25010:2023, benchmarked against a large international code base.
- Product documentation reviews. Review of available system documentation for, among other things, completeness and quality.
- Implemented architecture analyses. Measurement of the architecture as implemented and its deviation from the intended or documented architecture.
- Software component analyses. Decomposition into components, mapping of dependencies, and identification of structural and coupling-related risks.
- Technology stack obsolescence. Assessment of frameworks, runtimes and libraries against their end-of-life status and active maintenance.
- Cloud-readiness and modernisation. Evaluation of cloud-native fit: statefulness, configuration externalisation, packaging, and infrastructure dependencies.
The Maintainability Cloud
The results of the software due diligence assessments were plotted in the Maintainability Cloud, a single chart in which every system became a comparable data point against the international benchmark.
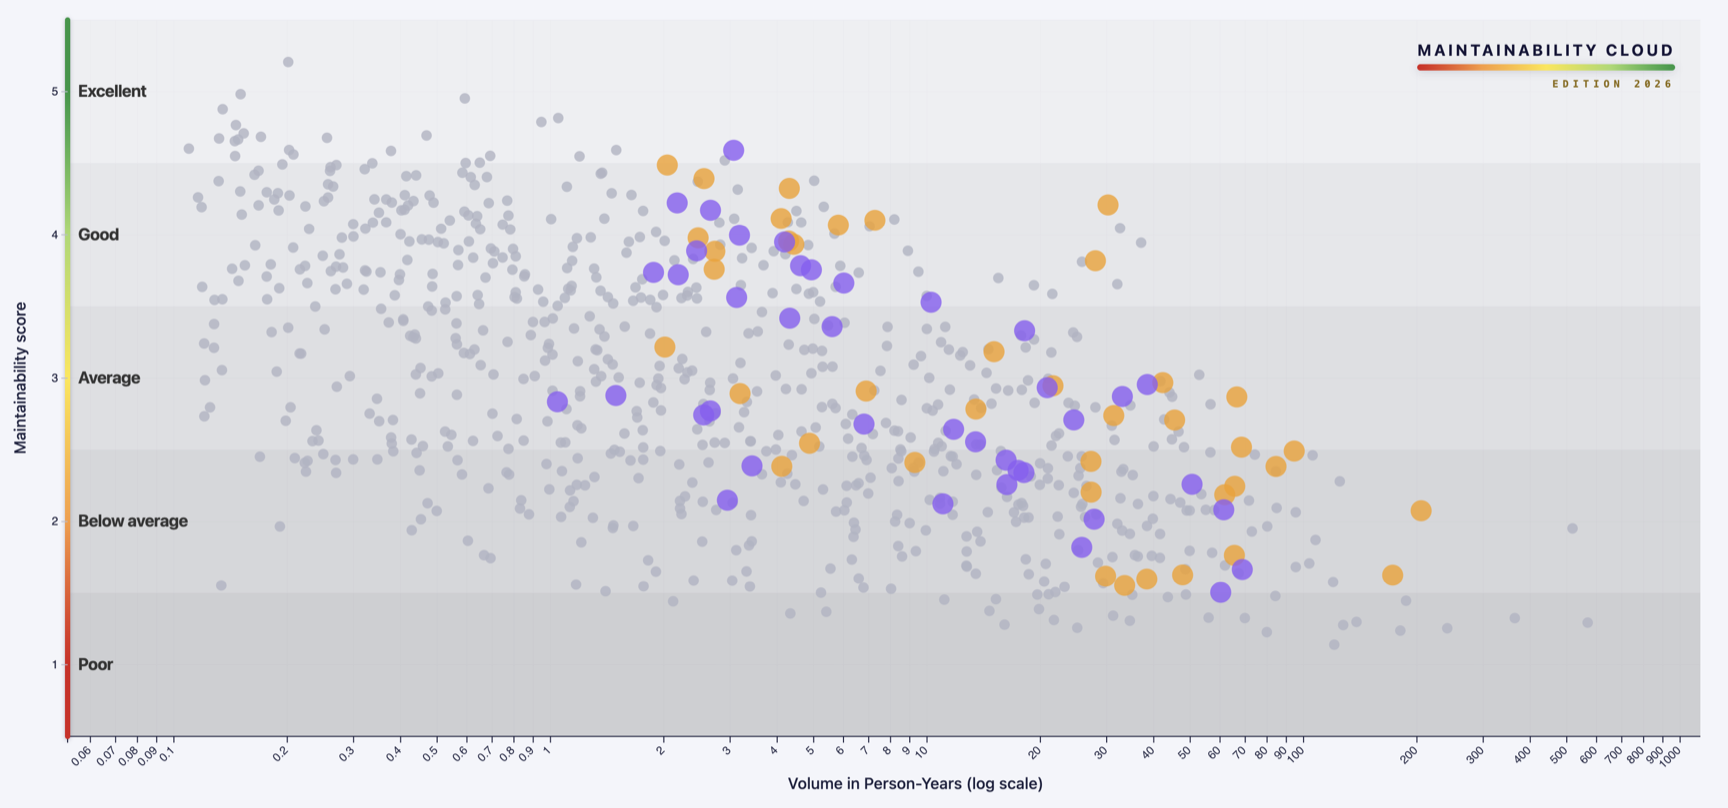
The two coloured series show the data points from two portfolios; the grey cloud is the international benchmark. Horizontal: volume in person-years, logarithmic. Vertical: maintainability score, 1 to 5. Smaller systems of higher maintainability sit in the upper-left; larger systems of lower maintainability sit in the lower-right. Size and low maintainability each raise the maintenance burden, which is therefore highest in the lower-right. The data in this diagram is illustrative of the measurements performed.
The measurements gave insight at the portfolio, application and repository levels. Combined with the other findings, for instance about the implemented architecture, they are the fact base beneath the recommendations.
An objective fact base for high-stakes decisions
The software due diligence gave group leadership a single, comparable view across two portfolios that had evolved independently for decades, replacing the argument about which system was better with a measurement of it.
What the engagement delivered:
- A like-for-like maintainability comparison across both portfolios, set against the international benchmark.
- A recommendation per business area resting on measured technical evidence rather than on the opinion of whichever team built the system.
- Portfolio-, application- and repository-level insight from one dataset, reused across the integration programme.
- A shared decision artefact, the Maintainability Cloud, that executives and engineers read the same way.
All recommendations were followed, but the highest-maintainability system was not always the one chosen. The measurement informed the decision; it did not make it.
- 5
- Divisions
- 50+
- Systems
- 250+
- Repositories
- 74
- Languages and asset types
- Millions
- Lines of code
To respect client confidentiality, this case description was anonymised and the data modified. The scale of the engagement and the impact of the results were as described.
Claroview was involved in the project through an intermediary company.